
About Button-level Performance metrics
Button-level performance reporting for a Flow allows you to understand the volume of traffic through each Step of the interactive experience.
It can be a helpful aid to learn which buttons are attracting the most visitors.
Viewing button-level Performance metrics for a Flow
Select a Published Flow from the table on the ↗️ Performance screen to open a Flow in view mode.
The values shown in yellow cover are for the period since the Flows first published date.
Metrics are only while a Flow is Published.
What we report on:
- Eye-catcher clicks (for Overlay Flows)
- Action button clicks
- The % split between routes
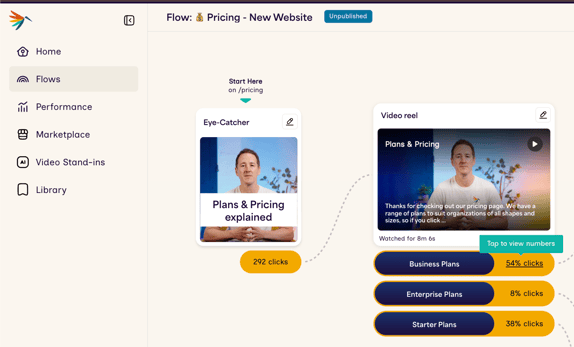
Changing button metrics from % values to counts
To see button click values as a overall percentage of all clicks, or alternatively as a raw click count, tap on the number inside the yellow button to toggle between these options.
Showing & hiding the Flow Overview flyover
While in Flow view mode, you can access a summary of the Flows performance metrics in the Flow Overview flyover.
You can show and hide this flyover using the option in the dropdown menu.